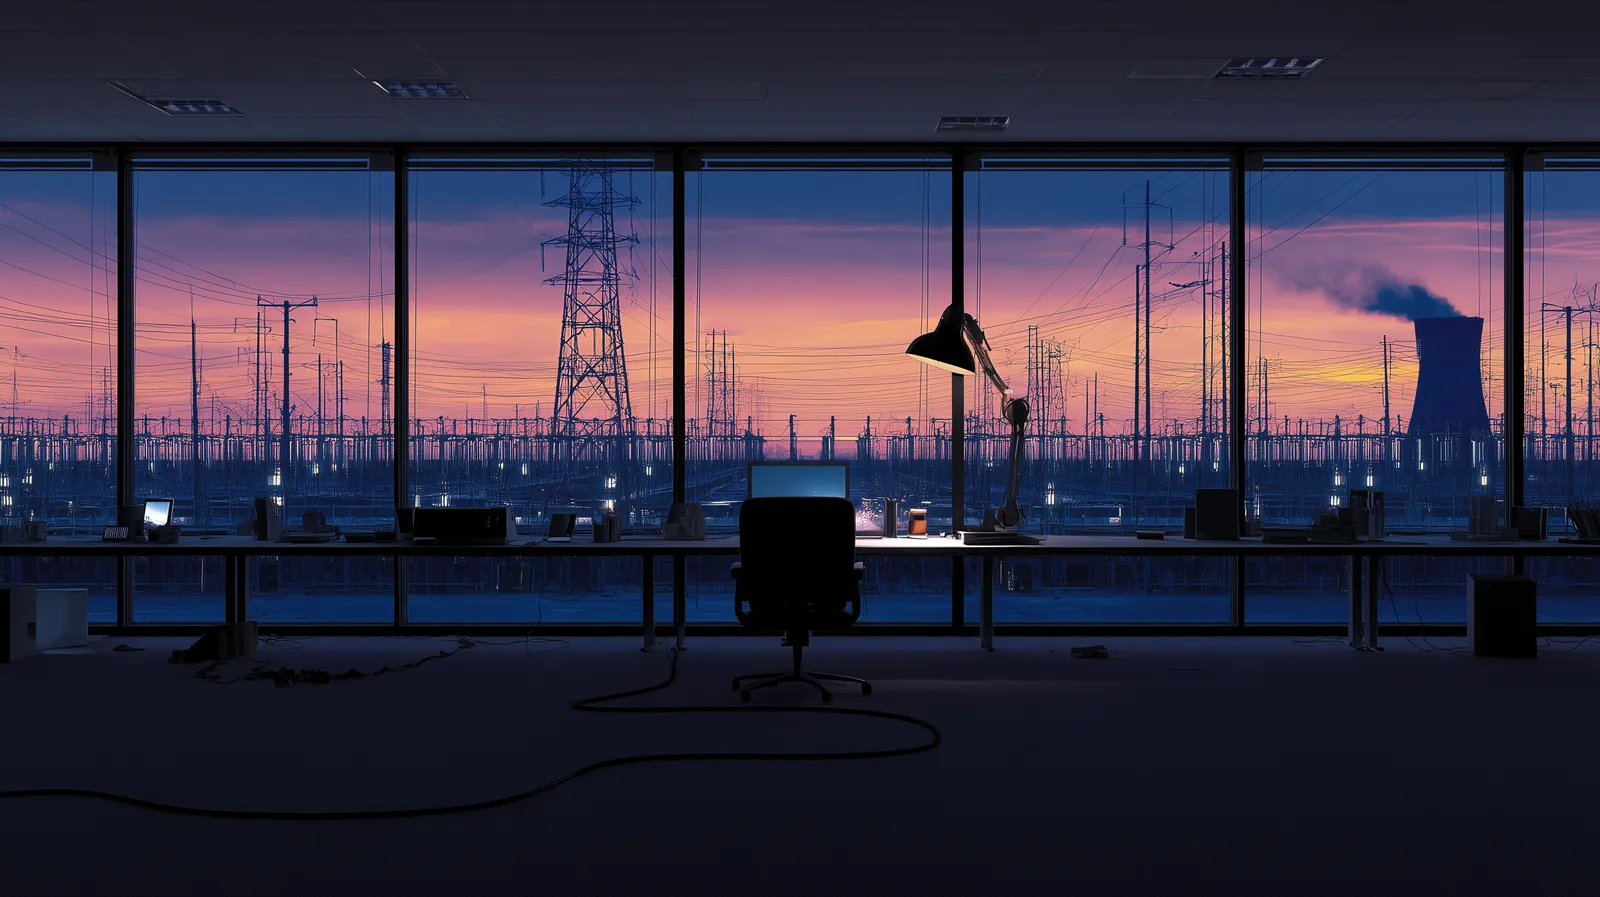
Software got cheaper to build, until you priced in copper, transformers, and a 128-week wait for a grid connection.
The cost of software didn't get smaller. It moved. From engineers on a Jira board to gigawatts on a power contract. From OPEX to CAPEX. From San Francisco headcount to Susquehanna nuclear PPAs. And if you are trying to figure out where AI value lands next, that migration is the only story that matters.
Three numbers anchor the rest of the piece. Four hyperscalers spent roughly $155 billion on capex in 2023. In 2026 they are projected to spend $600 to $690 billion, with about 75 percent going into AI infrastructure. Of the 16 gigawatts of US data center capacity planned for 2026, analysts expect about 12 GW to come online; 30 to 50 percent of individual projects are delayed or cancelled, mostly because the grid and the transformers cannot keep up. Klarna cut its workforce from 7,400 to around 3,000 while nearly doubling revenue per employee. Salesforce's Marc Benioff on the February 2025 earnings call: "We're not going to hire any new engineers this year."
That is the whole story in three lines. Labor compressed, infrastructure exploded, and the bottleneck moved from compute to copper. What follows is the arithmetic, the historical rhyme that tells us where this usually ends, and the handful of signals worth watching to know when the next layer takes over.
To stage it: in 2022, shipping a real piece of software meant hiring a team. A product manager to hold the roadmap. Four to eight engineers to build it. QA to test it. DevOps to deploy it. A security engineer before you went to market. Eighteen months in Jira. Today, three people with Cursor and Claude ship the same thing in six weeks. Midjourney ran to roughly $200M ARR with around 40 employees and zero outside funding. Cursor went from zero to $2B ARR in about three years. Y Combinator's Winter 2025 batch grew 10 percent per week in aggregate.
Most writing about this stops at "teams are smaller, velocity is faster, the AI-native stack wins." That framing misses the real story. The cost didn't disappear. It moved onto a different balance sheet, in a different column, denominated in GPUs and kilowatt-hours.
The Labor Layer Compressed. Here Is Where It Went.
$155 billion of hyperscaler capex in 2023 becomes $600 to $690 billion in 2026 (Epoch AI aggregating SEC filings; Morgan Stanley; CreditSights). US hyperscaler capex is now running at roughly 2 percent of US GDP, nearly twice the 1.2 percent peak intensity of the 1990s telecom buildout (Smead Capital). That is the scale of the migration.
On the labor side, the CEO quotes do the work more crisply than aggregate numbers.
- •Klarna. 7,400 employees to around 3,000. Revenue per employee climbed from $575K to nearly $1M (TechCrunch, May 2025). Klarna partially reversed this in 2025, rehiring some human customer service, so read it as a compression, not a collapse.
- •Salesforce. Marc Benioff, February 2025 earnings call: "We're not going to hire any new engineers this year. We're seeing 30 percent productivity increase on engineering."
- •Amazon. Andy Jassy, June 2025: "Our total corporate workforce will be smaller because of generative AI." Amazon cut 14,000 corporate roles in October 2025 and 16,000 more in January 2026.
Tech layoffs from 2023 through 2025 total around 540,000 (Layoffs.fyi). CS graduate unemployment sits at 6.1 percent, the seventh-worst across all majors (NY Fed, Q4 2025). Software developer job postings are down 71 percent from February 2022 to August 2025 (Indeed Hiring Lab / FRED).
The picture is not uniform. A METR study (July 2025) found experienced open-source developers were actually 19 percent slower using AI coding tools on real issues they had context on. A follow-up later in 2025 reportedly showed improvement as tools and user skill matured, but the original result matters: gains are real on net and unevenly distributed. Controlled experiments on specific tasks show 26 percent more PRs per week (MIT/Accenture/Microsoft RCT, Cui et al.) and 55.8 percent faster completion of greenfield tasks (Peng et al., 2023). Experienced engineers working on complex existing codebases have a different experience than greenfield builders, and the industry is only just starting to price that difference.
The New Bottleneck Isn't Compute. It's Copper.
Of roughly 16 gigawatts of US data center capacity planned to come online in 2026, analysts expect only about 12 GW will actually come online, with 30 to 50 percent of individual projects delayed or cancelled outright. Only about 5 GW is in active construction today (Sightline Climate via Bloomberg, April 1 2026).
Why? Not because GPUs are scarce. The reasons are structural.
- •Large power transformers now have a 128-week average lead time, with grid step-up units (GSUs) at 144 weeks (Wood Mackenzie, 2025). Pre-2020 lead times were 24 to 30 months. Today they approach five years. Wood Mac models a 30 percent US shortfall in 2025.
- •Grain-oriented electrical steel (GOES), the core material in those transformers, has one US producer: Cleveland-Cliffs. Global supply is concentrated at Nippon Steel, POSCO, and Thyssenkrupp.
- •Interconnection queues stretched from under 2 years in 2008 to over 8 years in PJM by 2025 (RMI). Lawrence Berkeley Lab's Queued Up 2025 edition counts 2,600 GW of capacity waiting in queues, against a 1,280 GW installed US base.
- •Morgan Stanley models a 49 GW US power shortfall through 2028.
The cost of AI software is now also the cost of pouring concrete, rolling electrical steel, and negotiating with rural utilities in West Texas and central Ohio.
This is why hyperscalers are doing things that would have sounded absurd three years ago. Announced commitments as of April 2026:
- •Microsoft and Constellation, reopening Three Mile Island as the Crane Clean Energy Center. 835 MW, 20-year PPA, $1.6B restart cost, target 2028.
- •Amazon and Talen Energy, a 1,920 MW PPA through 2042 on Susquehanna, plus a $500M lead investment in X-Energy targeting over 5 GW of SMR deployment by 2039.
- •Google and Kairos Power, up to 500 MW from seven SMRs by 2035, first online by 2030.
- •Meta's January 2026 nuclear announcement: commitments up to 6.6 GW across Vistra (over 2.6 GW of existing nuclear with uprates), TerraPower, and Oklo (1.2 GW).
Four of the most sophisticated software companies on earth are building their own nuclear supply. That isn't a software story. That's an infrastructure story.
Does the Arithmetic Work?
This is where skeptics plant the flag. Cumulative hyperscaler capex over 2024-2026 will land close to $1.2 to $1.5 trillion, with roughly $900B to $1.1T of that directly AI. Visible AI revenue today is a fraction of what would service it.
If you remember one thing from this piece, remember this three-variable model. The 2024-2026 AI capex clears a 15 percent hurdle rate by the end of the decade if and only if all three of these hold.
| Variable | Works at | Breaks at |
|---|---|---|
| Utilization (AI fleets) | 70% or better | 30-40% (typical enterprise today) |
| Revenue growth (AI-attributable, YoY) | 80-100% sustained to 2028 | Halves to 40-50% |
| Useful life (training-class GPUs) | 5+ years (with cascade to inference) | 2-3 years (Burry's claim) |
Visible AI revenue, summed from disclosed figures as of April 2026: Microsoft Azure AI at $13B ARR disclosed Q2 FY26, guided to $25B by end of FY26; Anthropic at $30B annualized run rate (Bloomberg; Axios calling it "the fastest-growing enterprise software company in American history"); OpenAI at approximately $25B ARR (Sacra); Meta AI-attributed ad revenue (Advantage+ suite) at over $60B annual run rate per Zuckerberg, Q4 2025; Google Cloud at $17.7B Q4 2025 revenue, up 48 percent YoY; AWS Bedrock at "multibillion-dollar, triple-digit growth"; plus smaller but real contributors (Anthropic's Claude Code at $2.5B; Perplexity at $500M; Mistral at over $400M).
Conservative sum: roughly $150 to $200 billion in visible AI revenue run rate, growing at roughly 100 percent YoY. That is 7 to 10 percent of the roughly $2 trillion per year Bain models the industry needs by 2030 to justify current capex. If 100 percent growth holds for three more years, the industry hits $1.2 to $1.6 trillion by 2029, inside the Bain threshold. That is also the precise point where the argument splits.
The capex works if demand keeps compounding, utilization improves, and useful life holds. It breaks if any two miss.
The 1990s Rhyme, and Where It Breaks
This pattern is not new. We have run a version of it before.
Between 1996 and 2001, US telecoms spent over $500 billion laying fiber, with peak annual capex of roughly $120 billion in 2000. They issued over $500 billion in bonds to finance it. Then it broke. Global Crossing filed Chapter 11 in January 2002 with $12.4 billion in debt. WorldCom filed in July 2002 with $103.9 billion in assets, the largest bankruptcy in US history at the time. Global telecom market cap between 2000 and 2002 fell by over $2 trillion. Estimates of installed US fiber actually "lit" by 2004 range from roughly 3 to 15 percent. The rest was dark.
And yet the buildout is exactly the thing that made the next two decades possible. Google, founded 1998, scaled on the overbuild. Netflix streaming launched in 2007 on the same infrastructure. AWS launched August 2006 at $0.10 per hour. IP transit prices fell from $1,200 per Mbps in 1998 to $0.63 per Mbps in 2015, approximately a 61 percent annual decline.
Carlota Perez wrote the textbook on this in 2002. Every tech cycle has two halves. An Installation Age: irruption, frenzy, overbuild, crash. Then a Deployment Age: the boring decades where productivity gains accrue to services built on the depreciated overbuild, not the companies that built it. Installation-Age winners are almost never Deployment-Age winners.
Where the analogy breaks: demand quality is different (AI is already monetized, fiber wasn't); balance sheets are different (Microsoft, Google, Amazon, and Meta have approximately $400B in combined trailing twelve-month operating cash flow); capital structure is different (mostly equity and operating cash flow, though JPMorgan and Morgan Stanley model $400B of hyperscaler debt issuance in 2026, up from $165B in 2025); and stack integration is different (hyperscalers own the model, the cloud, the distribution, and the enterprise channel).
These aren't reasons the analogy fails. They are reasons the magnitude and timing of the crash, if it comes, will be different. A cash-rich, vertically integrated oligopoly with rising demand can absorb an infrastructure oversupply far more gracefully than a leveraged commodity-transport industry could. What we should probably expect is not a WorldCom moment. It's slower revenue ramps, selective impairments, lease renegotiations, and capex discipline emerging unevenly across the group. Microsoft quietly paused some 2025 leases in Q1 2025. That's what the beginning of Perez's Turning Point actually looks like today.
The directional lesson is still intact: when infrastructure gets built in advance of demand, the value tends to migrate one layer up once the cost curves finish collapsing. That's what we should be watching for. Not the crash itself, but the services layer that inherits the overbuilt capacity.
The Starlink Precedent
Iridium went bankrupt in August 1999 after spending $5 billion to put 66 satellites in orbit. It had 10,000 subscribers, charged $3 to 8 per minute, and shipped a one-pound, $3,000 handset. Teledesic, Gates and McCaw's $9 billion "internet in the sky," suspended construction in October 2002 without launching operationally.
Both failed for the same reason: the supporting cost structure didn't exist yet. Launch cost has fallen roughly 20x (Space Shuttle at $54,500 per kilogram to LEO, Falcon 9 today at $2,720). Satellite cost has fallen roughly 10x (Iridium at $5M each, Starlink v1.5 estimated at $500K). User terminal has fallen roughly 5x in price for over 100x the bandwidth.
Starlink passed 10 million subscribers in February 2026, hit cash-flow break-even in November 2023, and booked $11.4 billion in revenue in 2025 at 63 percent EBITDA margins. The same business model failed in 1999 and works in 2024. Nothing about the demand side changed. What changed was the supply side. Launch cost, satellite cost, and terminal cost all bent at roughly the same time.
That is the question worth asking about AI infrastructure. Which supply-side curves bend first, and when?
What to Actually Watch
Strip the piece down to the few signals that tell you whether this cycle is tracking the pattern or breaking from it. There are five.
1. Utilization. SemiAnalysis's H100 break-even model assumes 85 percent fleet utilization. Enterprise fleets run at 13 to 30 percent. Hyperscaler fleets are better but undisclosed. Every point of utilization is a point of ROI. If you operate one of these fleets, this is the number that gets you fired. Instrument it.
2. Power contracts, not model benchmarks. The binding constraint on 2026-2028 AI capacity isn't FLOPS. It's megawatts with signed PPAs and an interconnection queue position. Count signed PPAs, not headline gigawatts. Meta's 6.6 GW is mostly announcement; Amazon-Talen's 1,920 MW is a contract.
3. Depreciation policy. Hyperscalers extended GPU depreciation schedules to six years during the early 2020s. If actual useful life is three to four years, reported earnings across Meta, Oracle, Microsoft, Google, and Amazon are overstated. The disclosure is in the 10-K under "useful life of servers and network equipment." Read those lines before the press release.
4. Custom silicon and rental prices. NVIDIA's data center gross margin north of 70 percent is the single biggest transfer of value in this cycle. Trainium, TPU, MTIA, and the neocloud market are the pressure on that number. Watch the SemiAnalysis H100 rental index and NVIDIA's segment margins together. When they move in opposite directions, the pricing power is breaking.
5. Debt issuance cadence. AI capex is still mostly funded out of operating cash flow. JPMorgan and Morgan Stanley model $400B of hyperscaler debt issuance in 2026, up from $165B in 2025. The shift from equity and cash to debt is the signal that the late-stage of the cycle has arrived. Every Perez Installation Age ended the same way: the infrastructure kept getting built on borrowed money long after the revenue stopped justifying it.
Everything else is noise. Measure fleet utilization like it's the number that gets you fired. Watch the power contracts. Read the footnotes. The rest will sort itself out.
The Shape of the Thing
The history of computing is the history of cost curves collapsing and the value layer migrating with them.
Mainframes gave way to minicomputers. Hardware gave way to PCs. PCs gave way to web. Web gave way to mobile. Mobile gave way to cloud. Cloud is giving way to AI. At each transition, the previous infrastructure winners underperformed the next layer's services winners. IBM didn't win the PC era. Sun didn't win the web. BlackBerry didn't win mobile. Cisco didn't win the cloud.
Today, NVIDIA and the hyperscalers are printing money. Their 1990s equivalent was Lucent, Nortel, and Cisco on the fiber side, Motorola on the satellite side. They were right about the demand. They weren't right about where the value would sit once the buildout finished.
The cost of software used to live in people. Today it lives in GPUs, grid capacity, and grain-oriented electrical steel. The next move is already visible at the edges: power contracts, custom silicon, on-device inference, services companies that own no hardware. When the transition happens it won't look like the end of anything. It will look like the beginning of what comes next.
Watch the power contracts. That's where this cycle turns.
Sources: Epoch AI Hyperscaler capex trend (Feb 2026); Morgan Stanley; CreditSights; Sightline Climate via Bloomberg (Apr 1 2026); Wood Mackenzie; RMI; LBNL Queued Up 2025; EPRI Powering Intelligence (May 2024); Bain 6th Global Technology Report (2025); Sequoia David Cahn AI's $600B Question (Jun 2024); Goldman Sachs Gen AI: Too Much Spend? (Jun 2024) and Why AI Companies May Invest More Than $500B in 2026 (Dec 2025); SemiAnalysis H100 Cloud TCO model; Layoffs.fyi; NY Fed Labor Market for Recent Grads (Q4 2025); Indeed Hiring Lab / FRED; METR Jul 2025 study; MIT/Accenture/Microsoft field experiment (Cui et al.); CEO statements (Benioff Feb 2025, Jassy Jun 2025, Zuckerberg Jan 2025, Lütke Apr 2025); Andrew Odlyzko papers (1998-2003); Smead Capital; Carlota Perez, Technological Revolutions and Financial Capital (2002); planet4589.org; Sacra; Daron Acemoglu, The Simple Macroeconomics of AI (NBER WP, May 2024); David Cahn (Sequoia); Jim Covello (Goldman Sachs); Michael Burry (late 2025).